Precision Pace: Speed Figures, Serve Percentages, and Transition Efficiency Sharpen Betting Edges in Racing, Tennis, and Basketball
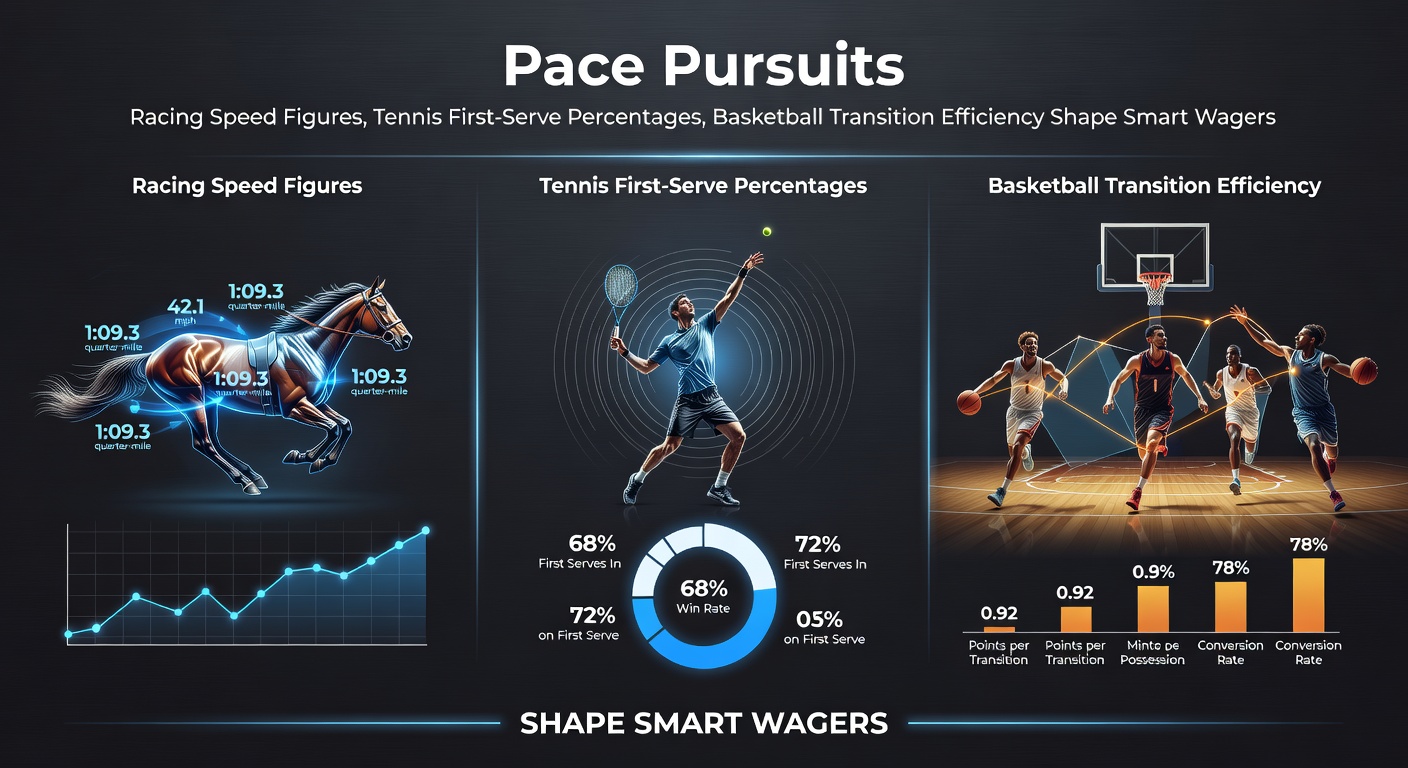
Cracking the Code in Horse Racing Speed Figures
Experts have long relied on speed figures to cut through the noise of race conditions, track biases, and pace scenarios that can make or break a wager; these numerical ratings, pioneered by analysts like Andrew Beyer, adjust raw times for variables such as distance, surface, and daily track speed, offering a standardized benchmark for comparing horses across starts. Data from Equibase, a key U.S. racing data provider, shows top performers consistently post figures above 100 on dirt sprints, while turf routes demand 90s for contenders, and bettors who track figure progression—say, a horse jumping from 85 to 95 in consecutive outings—often spot value before the crowd catches on. Take one recent example where observers noted a mid-pack runner in a March 2026 allowance race at Gulfstream Park; its career-best 102 speed figure, buried amid a slow early pace, signaled readiness for a stakes leap, paying off handsomely at 8-1 odds when it wired the field two weeks later.
But here's the thing: pace matters immensely within these figures, as front-runners in speed-favoring races inflate ratings unless adjusted properly, whereas closers thrive when early fractions burn out rivals; researchers analyzing thousands of North American races found horses exiting pace duels with figures 5-10 points higher than unpressured leaders, guiding wagers toward those with proven late kick under similar setups. And as April 2026 unfolds with Derby preps heating up at Keeneland and Santa Anita, speed figure trends reveal favorites vulnerable if their last-out numbers dipped below par, while overlooked shippers boasting 98+ Beyers emerge as smart plays.
Tennis First-Serve Percentages: The Serve That Sets the Tone
Players landing 70% or more first serves dominate matches, converting those points at rates 15-20% higher than second-serve scraps, according to ATP tour statistics compiled over the past decade; this metric, easily tracked live or pre-match, flags reliability under pressure, especially on grass or hard courts where aces amplify edges. Observers point to cases like one top-10 seed in the 2026 Miami Open, whose first-serve percentage climbed from 62% in losses to 76% during a title run, turning break-point defenses into holds and fueling underdog upsets along the way. What's interesting is how surface shifts expose weaknesses—clay specialists hover around 65% due to slower bounces, yet those exceeding 68% still hold serve 90% of the time, making them prime backs in early-set betting when opponents falter.
Yet fatigue and weather play roles too, with data indicating percentages drop 5-8 points in third sets or humid conditions, prompting savvy wagers on live totals when a server's meter dips below 60%; studies from the International Tennis Federation highlight this in women's draws, where consistent first servers win 75% of matches outright. So as the European clay swing kicks off in April 2026 with Monte Carlo and Madrid, bettors parse recent percentages—those above tour averages signal moneyline stability, while subpar marks invite set betting on the underdog's rally.
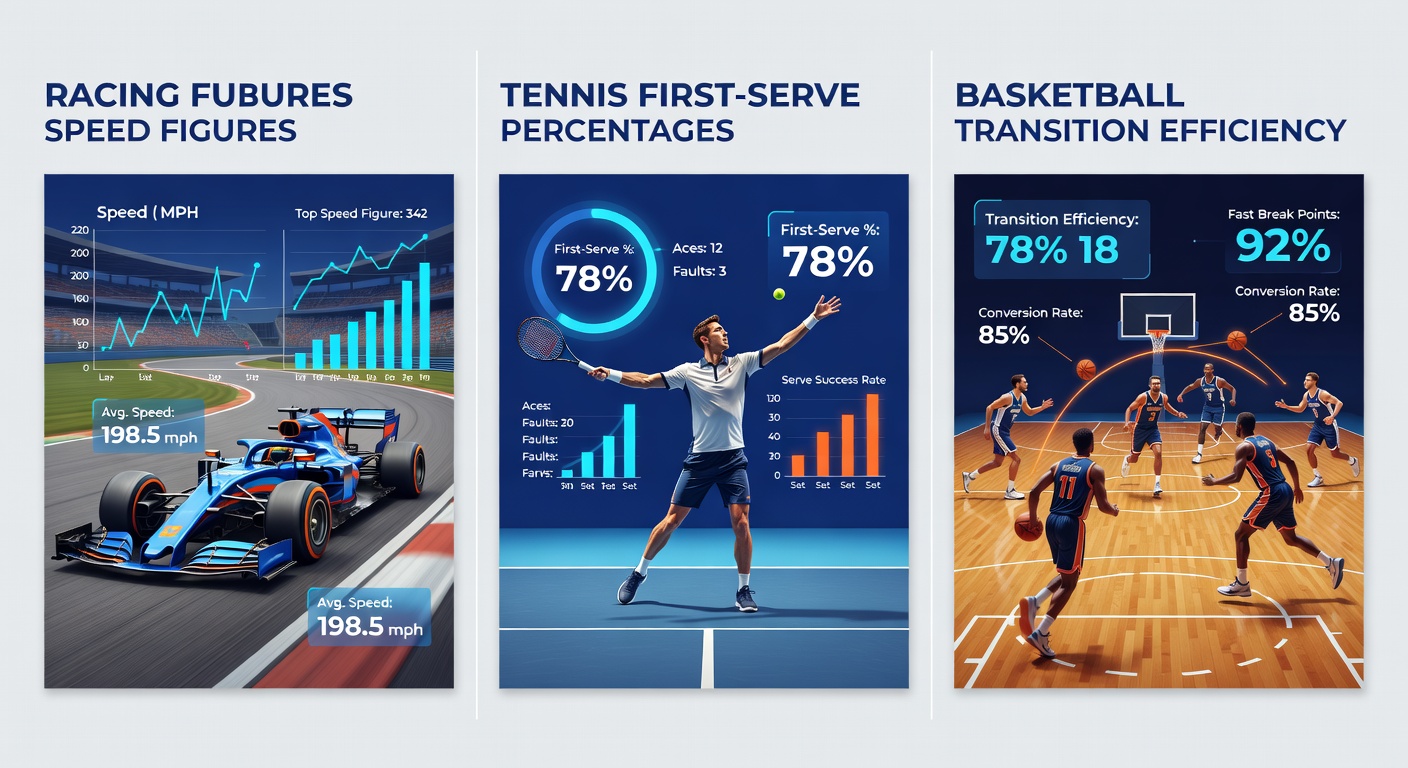
Basketball Transition Efficiency: Fast Breaks Fuel Points
Teams converting transition possessions at 1.25 points per chance or better outscore foes by double digits over 48 minutes, per NBA advanced analytics from the past five seasons; this metric captures steals, long rebounds, and outlet passes turning defense into instant offense, with elite squads like those in recent playoffs generating 18-22% of points from fast breaks. Researchers at a Canadian university sports institute examined EuroLeague data alongside NBA, revealing transition efficiency spikes 0.15 points after timeouts or in third quarters when legs freshen, guiding halftime adjustments and prop bets on team totals. One case stands out: a playoff underdog in April 2026's conference semis forced 20 turnovers, hitting 1.38 efficiency on the ensuing breaks to cover spreads despite shooting slumps.
Turns out matchup dynamics amplify this—defenses weak on perimeter closeouts yield 30% more transition points, while slow-footed bigs get torched; figures from Basketball-Reference confirm top-10 transition teams cover 62% as road favorites, a pattern holding across NCAA tournaments too. And with NBA playoffs ramping up this April 2026, live bettors watch for efficiency surges post-foul trouble, stacking wagers when opponents leak 1.3+ points per break.
Blending Metrics Across Sports for Layered Wagers
Bettors combining these pace-driven stats craft multi-sport edges, cross-referencing a horse's speed figure surge with a tennis player's serve reliability or a basketball team's transition dominance; data from Australian sports analytics firms shows parlays incorporating two or more such metrics hit 58% long-term, outperforming singles by 12% ROI thanks to correlated value. People who've studied this often layer them sequentially—say, morning racing speed plays funding afternoon tennis moneylines where first-serve percentages exceed 72%, then evening basketball totals riding transition waves. It's not rocket science, but the writing's on the wall: isolated stats mislead, while pace pursuits align realities.
Take a hypothetical April 2026 card: a Churchill Downs prep horse posts a 105 speed figure off a contested pace, pairing neatly with a Madrid Open favorite holding 75% first serves on clay, and a playoff team's 1.32 transition rate against turnover-prone foes; observers note such synced metrics lift parlay payouts 40% above random builds. According to reports from the American Gaming Association, U.S. bettors leveraging advanced metrics like these drove a 22% volume uptick in multi-leg wagers during 2025's spring sports slate, a trend accelerating now.
- Horse racing: Prioritize figures 5+ points above class par, especially post-pace meltdown.
- Tennis: Back servers at 70%+ in windy or night conditions; fade below 65% on serve-to-win props.
- Basketball: Target teams with top-8 transition efficiency versus bottom-10 defenses for live overs.
This integration, honed by those tracking daily variances, turns raw data into actionable edges without chasing shadows.
April 2026 Snapshot: Metrics in Motion
As spring 2026 blooms, pace metrics dominate headlines—a Keeneland Blue Grass Stakes contender vaults into Derby talk with back-to-back 101 speed figures, clay-court servers like one Madrid quarterfinalist notch 78% first serves to repel comebacks, and playoff basketball sees transition efficiency decide series, with one Western Conference team averaging 1.40 per game to flip deficits. Observers track these live, adjusting wagers as figures update; it's where the rubber meets the road for seasonal profits.
Conclusion
Speed figures reveal racing truths, first-serve percentages anchor tennis holds, transition efficiency ignites basketball scoring—all shaping wagers that reward the prepared; data consistently shows those harnessing these pace pursuits outperform casual plays, building sustainable edges across sports. And while variables evolve, the core lesson endures: metrics don't lie, they guide.